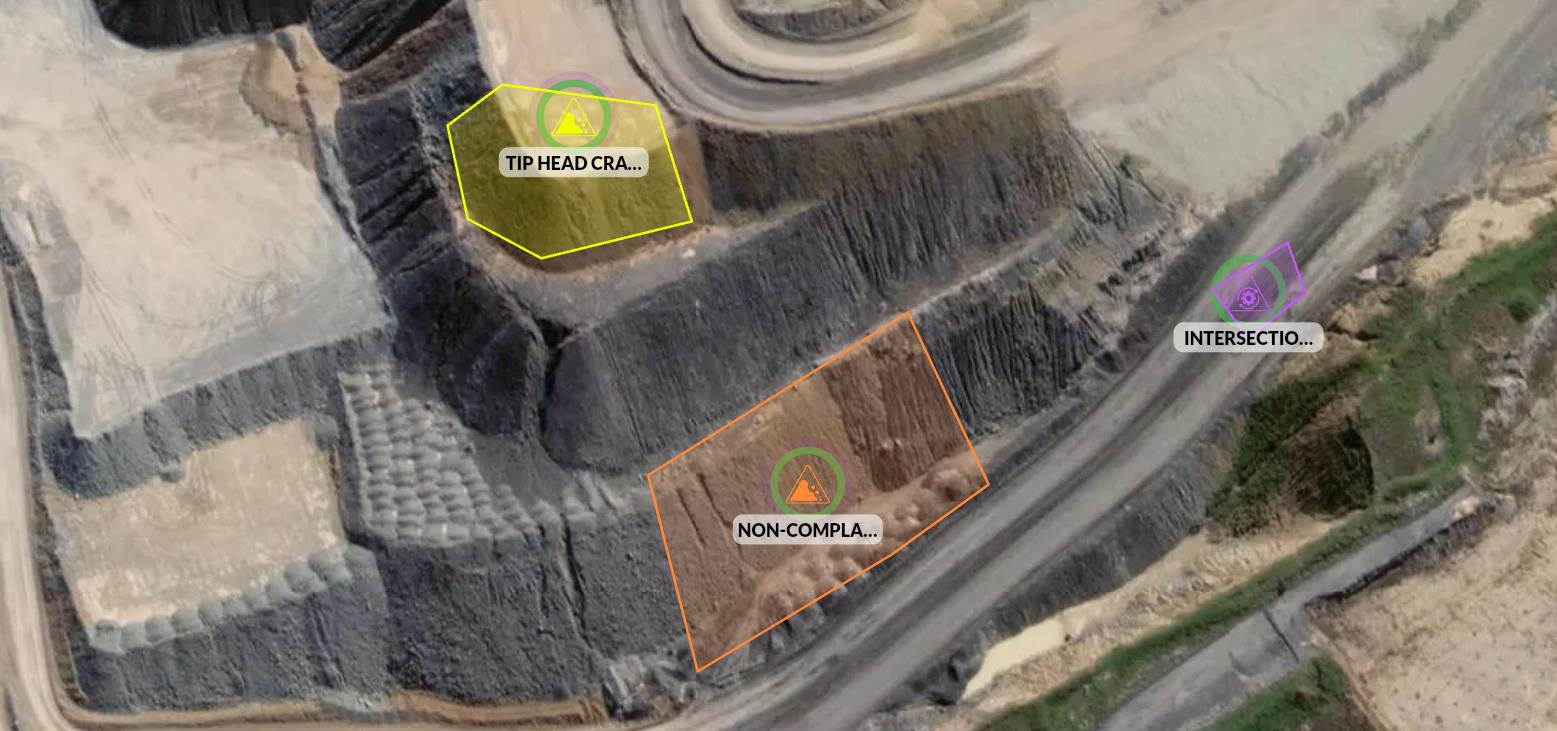
Across open cut mines, some OCE reports are one page and some are nine. Some are organised by area, some by machine, some are a list of yes and no questions. Some are typed into a system and some are still written on paper on the bonnet of a ute. They are all discharging the same statutory function.
Are they all equal? This article works through what the legislation actually requires, the four structures sites land on, what each one does to the way hazards get communicated, and where the industry is heading. It is drawn from a presentation given to Queensland site senior executives.
Free download: the full 29-slide presentation this article is based on.
Get the PDFWhy the OCE report matters
The Open Cut Examiner report is the primary record of supervision on an open cut mine. It captures:
- The inspections that were carried out.
- The hazards that were identified.
- The controls that were implemented.
- The communication passed between shifts.
For most of its life it is a working document. During an investigation it becomes critical evidence, and it is read by people who were not there, months or years after the shift it describes.
What the legislation actually requires
This is the point that explains most of the variation between sites. The legislation defines what must occur, not what the report must look like.
Broadly, the requirements are that work areas are inspected, hazards are identified, controls are documented, examiners communicate with each other, and records are retained in the mine record. Everything past that is site interpretation.
Queensland
The framework sits in the Coal Mining Safety and Health Act 1999 and the Coal Mining Safety and Health Regulation 2017. Chapter 3 covers surface mines. In practice it requires that before carrying out inspections the examiner reads the previous report and acknowledges having read it, that the excavation and nearby areas where activities are to be carried out are inspected before activities start and periodically as required under the safety and health management system, and, under section 141(2)(b), that the results of the inspection including details of hazards and recommended corrective action are made available to coal mine workers.
Note what that last requirement is really asking. Not that the report exists. That the results are made available to the workers.
New South Wales
NSW works from the Work Health and Safety Act 2011, the Work Health and Safety (Mines and Petroleum Sites) Act 2013 and the Work Health and Safety (Mines and Petroleum Sites) Regulation 2022, with responsibilities set out in more detail in the statutory function description published by the NSW Resources Regulator.
That description asks the examiner to read and sign off the previous shift report and communicate as required, carry out the mine inspection plan and make entries in the shift report, complete and sign off the shift report, and communicate with the oncoming examiner. The duties are described in more detail than in Queensland, but the format of the report itself is still left to the site.
What industry noticed a decade ago
Cres Bulger reviewed OCE reporting across the industry in 2015 and the findings have aged well, which is the uncomfortable part.
The issues he raised were about complexity and access rather than compliance. Where multiple OCEs work the same shift, it is not always clear who inspected what. Reports are not always easily available to the people who need them. And the harder question underneath: do coal mine workers actually read the report, and is it practical for them to do so?
The good practices he identified are still the benchmark:
- The OCE report is presented during pre-starts.
- Information relevant to the crew is provided to the crew.
- Hazardous areas and their controls are simple to identify.
- The time of inspection is shown.
Worth asking of your own site: can your team do all four today?
The four ways sites structure an OCE report
Almost every report in use falls into one of four structures. Each one changes how information reaches the crew.
Area based
Organised by pit or work area. The structure is simple and it is easy to reference the status of a location. The limitation is that equipment locations are not obvious, and it is difficult to present quickly in a pre-start. Area reports work best when they are printed and reviewed in detail.
Machine based
Built around equipment. Crews relate to it immediately and it is useful for pre-start communication, because people are being told about the machine they are about to operate. The limitation is that machines move during the shift, and on a large site the tables get very large. Splitting by region, north and south or by strip, keeps it manageable.
Combination
A mix of area and machine information. It gives broad situational awareness and produces useful summaries for communication. The cost is complexity, and reports can become cluttered quickly. The balance between detail and usability is the whole game here.
Checklist driven
Structured questions guide the inspection, which prompts consistent coverage. The risk is that a page of yes answers encourages tick and flick, and a yes or no answer oversimplifies the risk. The quality of a checklist report depends almost entirely on the comments attached to it. It is also the structure that is hardest to present usefully in a pre-start.
There is no universal standard
Every structure trades something away.
- Area reports are geographically clear but less operationally relevant.
- Machine reports are operationally useful but geographically weak.
- Checklists are structured but drift towards the administrative, and reconciling them across a shift is difficult.
The patterns are reasonably consistent across the industry. Smaller sites trend towards operational, machine oriented reports. Large sites trend towards area based. NSW trends towards checklists. None of that is prescribed anywhere. It is the accumulated result of local decisions.
The core limitation: a report is a snapshot
Whatever structure it uses, an OCE report is a static document. It represents a moment in time and its relevance is highest at the start of shift, then decays. The mining environment does not hold still. What was true at 6am may not apply by midday.
There is a second cost that gets less attention. The more complex the report, the more of the shift is spent writing it rather than being in the field. Detail added to a report is time removed from inspection.
The questions an investigation will ask
When something goes wrong, the questions come quickly and they are always the same ones:
- When was this area last inspected?
- When was the hazard first identified?
- What controls were in place, and what controls were not?
- Who communicated this information to the crews?
Take your current report format and test it against those four questions. If answering them means reading through a stack of shift reports and reconstructing a timeline by hand, the format is doing the site a disservice long before anyone gets to the content.
Where text based reporting struggles
Text is a poor medium for three things an OCE report has to convey.
Precise location. “Turn left at Ramp A and continue roughly 200m to the insufficient bund” is a description that depends on the reader already knowing the pit.
Changed conditions. A written report updates once per shift. Conditions do not.
Technical description. Describing the geometry of a crack in a sentence is hard. A photograph does it instantly.
The test is simple: can a worker who has never been to that part of the site confidently identify the hazard and its controls from what is written? Visual communication improves that dramatically, and visual guides are still not standard in OCE reports.
Static text versus spatial information
Traditional reporting gives you text descriptions, isolated hazard entries or general comments, and limited historical context. Each shift starts close to a blank page.
Spatial systems and electronic checklists change the shape of the information. Hazards are mapped to locations rather than described. Inspection history is tracked against those locations. Over time, trends emerge that no individual shift report could ever show.
What happens when reporting gets easy
One consistent finding from the field: if you make it simple, workers will collect the data.
Smaller hazards such as pooling water, damaged signage and intersection maintenance were routinely fixed on the spot and never logged. Not through reluctance, but because logging them cost more effort than fixing them. Those small and frequent hazards are exactly the ones that produce valuable trends once capturing them is quick.
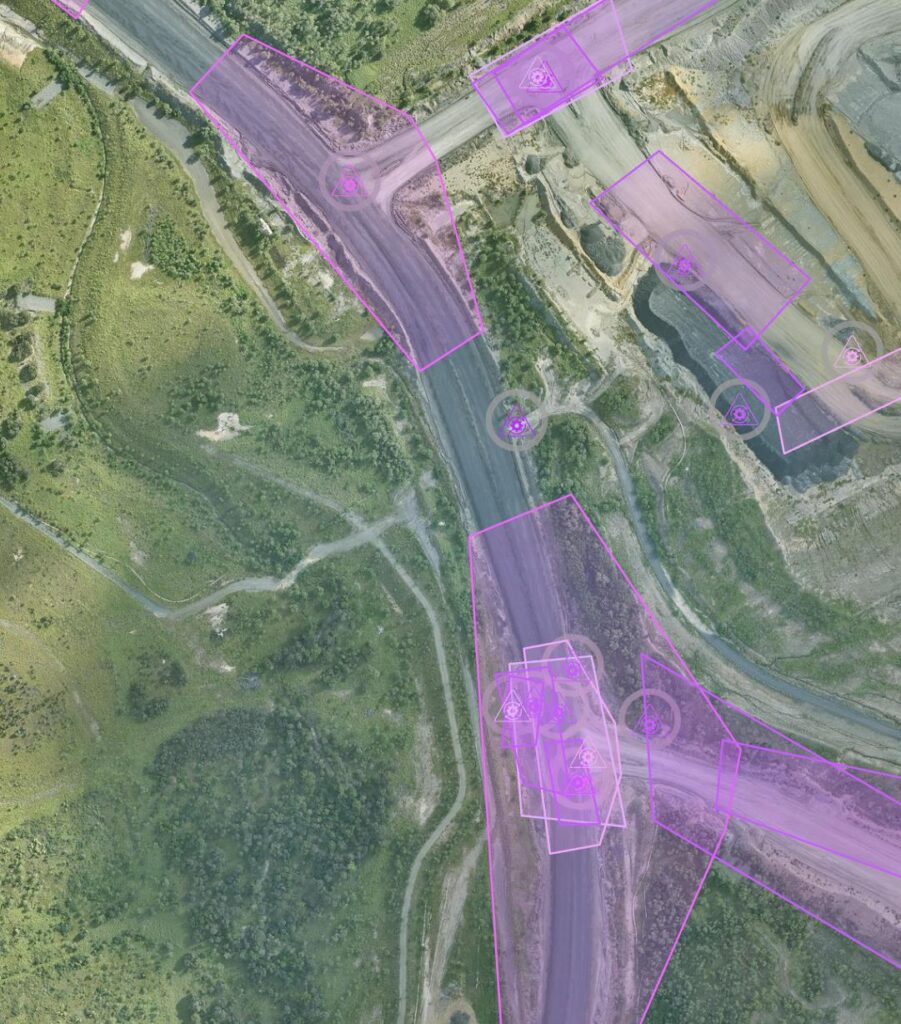
Plotted over time, that data highlights recurring issues at key intersections: pooling, bunding and poor drainage, geometry or signage that does not match the design, the same locations flagged again and again. Visual history makes it obvious where problems persist, which areas are not improving, and where remediation effort will actually pay off.
Where the industry is heading
The direction of travel across open cut operations is consistent: electronic inspections, photographic records of changed conditions, timestamped data and automated reporting.
The benefit is not primarily compliance. It is that these tools reduce administration and improve traceability at the same time, which puts OCEs back in the field instead of behind a screen. Bulger called tablets the way of the future in 2015. A decade on, that has largely proven correct.
Key takeaways
- OCE reports vary widely between sites, and legally they are entitled to.
- Legislation defines intent, not format.
- Report structure directly influences how well hazards are communicated.
- Static reports struggle to represent a dynamic operation.
- Clear communication of hazards, controls and history is the actual objective. The report is the means, not the end.
Download the full presentation
The complete slide deck, Same Role, Different Output: How OCE Reports Vary by Site and State, is available as a PDF. It includes the legislative extracts, the Bulger findings, worked examples of each report structure and the spatial reporting comparisons.
Free download
Same Role, Different Output: How OCE Reports Vary by Site and State
Your download has started
Thanks. If nothing happened, download the PDF here.
 Scan to open this page and download the deck
How HazView approaches this
The gap this article describes is between a report that is a document and a pit that is a moving object. Holding hazards, controls, inspection times and history against the locations they physically belong to closes that gap, and produces the statutory record as a by-product rather than as a separate writing task. That is what HazView for OCEs was built to do. If you want to see it against your own report format, book a demo.
Related guides
- Queensland OCE Report Requirements
- The Future of Open-Cut Mining Safety: Lessons from OCE Shift Reports
- High Potential Incident (HPI) Reporting in Queensland: Duties and Timeframes
- Digitising OCE Reports and Statutory Inspections
- All Statutory Reporting guides
Frequently asked questions
Does the legislation specify an OCE report format?
No. Queensland and NSW both define what must occur: areas inspected, hazards identified, controls documented, communication between examiners and records retained. Neither prescribes a layout, a length or a medium. That is why reports vary so widely between sites doing identical work.
Is an area based or machine based report better?
Neither is universally better. Area based reports are geographically clear but harder to use in a pre-start. Machine based reports communicate well to crews but lose accuracy as equipment moves through the shift. The right choice depends on site size and how the report is actually used, and many sites end up with a combination.
Are checklist based OCE reports compliant?
A checklist can meet the statutory requirements, and they are common in NSW. The risk is practical rather than legal: yes and no answers oversimplify risk and encourage tick and flick. The value sits in the comments, so a checklist without substantive comments is weak evidence of supervision.
Can an OCE report be electronic?
Yes, provided the record is retained in the mine record and the results are made available to coal mine workers. Electronic inspections generally improve traceability because they timestamp entries, attach photographs and preserve inspection history automatically.
How long should an OCE report be?
There is no prescribed length, and reports in use range from one page to nine. Longer is not safer. Every extra field is time an examiner spends writing rather than inspecting, so the useful test is whether a worker can read it and act on it, not how much it covers.
What should an OCE report include so it holds up in an investigation?
At minimum it should let a reader answer four questions without reconstruction: when the area was last inspected, when the hazard was first identified, what controls were and were not in place, and who communicated the information to the crews. Timestamps, precise locations and photographs are what make those answers quick.